ASRock Challenger RX 9050 8GB vs Nextron RX 7600 XT 16GB
The ASRock Challenger RX 9050 8GB uses the AMD RX 9050, 8 GB, while the Nextron RX 7600 XT 16GB uses the AMD RX 7600 XT (RDNA 3), 16 GB GDDR6 on a 128-bit bus, 190 W board power.
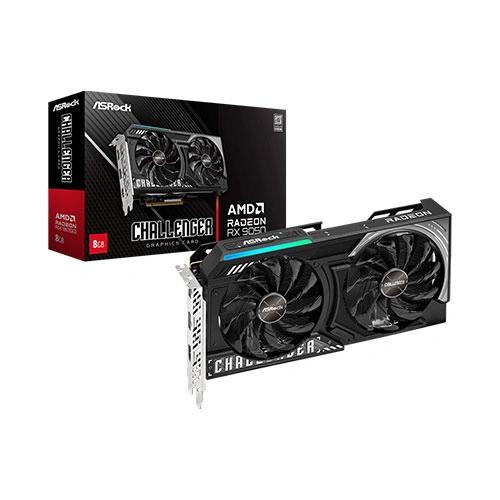
Final score
50 / 100
Lowest price
₹33,999
at Computech Store
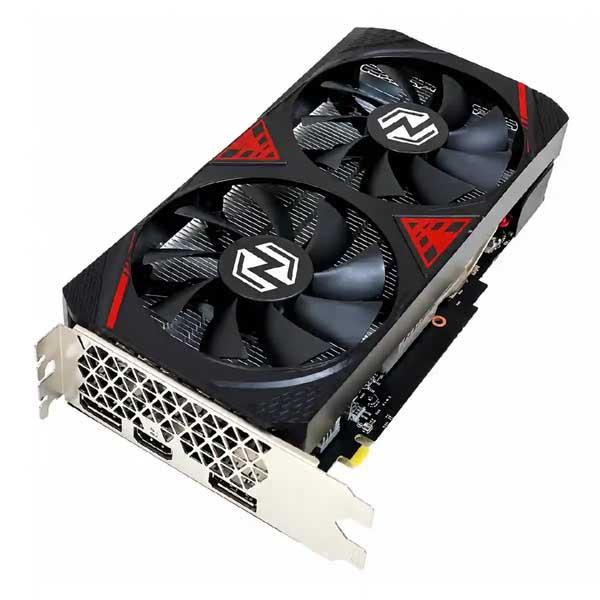
Final score
100 / 100
Lowest price
₹44,999
at Computech Store
Compare different graphics cards
Overview
Sub-scores from 0 to 100, relative to the best product in our database.
Scoring for: Balanced
Value for money
Balanced score points per ₹1,000, using today's lowest in-stock prices.
1.47
score points per ₹1,000
2.22
score points per ₹1,000
ASRock Challenger RX 9050 8GB is ₹11,000 cheaper right now.
The verdict
Nextron RX 7600 XT 16GB is the better graphics card overall, scoring 100 vs 50.
- It leads in vram (+100%).
- It's also the better value for money at current prices.
- Nextron RX 7600 XT 16GB uses a PCIe x8 link; on PCIe 3.0 motherboards it can lose some performance.
- ASRock Challenger RX 9050 8GB's 8 GB of VRAM can hold back newer games at high settings, especially at 1440p.
Pick ASRock Challenger RX 9050 8GB if…
- you want to save money (cheaper by ₹11,000)
Pick Nextron RX 7600 XT 16GB if…
- you game at 1080p or play esports titles (1080p Gaming score 100 vs 50)
- you play at high settings, use big texture packs or run AI models
The TL;DR is above. The very long DR is below. ↓
Key differences
Only real differences in specs, scores and price. Ties are left out.
Advantages of ASRock Challenger RX 9050 8GB
- Cheaper by ₹11,000
Advantages of Nextron RX 7600 XT 16GB
- 100% more VRAM headroom
- 8 GB more VRAM (16 vs 8 GB)
Benchmarks
Chip-level results: cards using the same GPU perform within a few percent of each other. (est.) marks estimated values.
Gaming performance
Relative average FPS across a game suite (RTX 5090 = 100 at each resolution). Higher is better.
Ray tracing
Relative average FPS with ray tracing on at 1440p (RTX 5090 = 100). Higher is better.
3DMark Time Spy
DirectX 12 synthetic graphics score. Higher is better.
Blender (GPU render)
Blender Open Data median score with CUDA/OptiX, HIP or oneAPI. Higher is better.
Efficiency
Time Spy graphics score divided by rated board power. Higher is better.
Full specifications
The better value is highlighted. “—” means we don't have that spec yet.
| General | ASRock Challenger RX 9050 8GB | Nextron RX 7600 XT 16GB |
|---|---|---|
| GPU | RX 9050 | RX 7600 XT |
| Architecture | — | AMD RDNA 3 |
| Release Date | — | Jan 2024 |
| Factory Overclocked | No | No |
| White Edition | No | No |
| GPU Core | ASRock Challenger RX 9050 8GB | Nextron RX 7600 XT 16GB |
|---|---|---|
| Shader Units | — | 2,048 |
| Base Clock | — | 1,980 MHz |
| Boost Clock | — | 2,755 MHz |
| L2 / Infinity Cache | — | 32 MB |
| Process Node | — | 6 nm |
| Memory | ASRock Challenger RX 9050 8GB | Nextron RX 7600 XT 16GB |
|---|---|---|
| VRAM | 8 GB | 16 GB ✓ |
| Memory Type | — | GDDR6 |
| Memory Bus | — | 128-bit |
| Memory Bandwidth | — | 288 GB/s |
| Power | ASRock Challenger RX 9050 8GB | Nextron RX 7600 XT 16GB |
|---|---|---|
| Board Power | — | 190 W |
| Recommended PSU | — | 600 W |
| Power Connector | — | — |
| Interface & Features | ASRock Challenger RX 9050 8GB | Nextron RX 7600 XT 16GB |
|---|---|---|
| PCIe Version | — | 4.0 |
| PCIe Lanes | — | x8 |
| Hardware Ray Tracing | — | 2nd gen |
| Upscaling | — | FSR 3 |
| Frame Generation | — | FSR 3 Frame Generation |
| AV1 Encoding | — | Yes |
Related comparisons
- ASRock Challenger RX 9050 8GB vs Gigabyte Windforce V2 RTX 3050 OC 8GB
- ASRock Challenger RX 9050 8GB vs ASUS Dual RTX 3050 OC 6GB
- ASRock Challenger RX 9050 8GB vs NVIDIA Quadro RTX A400 4GB
- ASUS Dual RX 7600 OC 8GB vs Nextron RX 7600 XT 16GB
- Gigabyte Windforce V2 RTX 3050 OC 8GB vs Nextron RX 7600 XT 16GB
- Gigabyte Windforce RTX 5060 OC 8GB vs Nextron RX 7600 XT 16GB